 Geosur
dataset
Type of resources
Available actions
Topics
INSPIRE themes
Keywords
Contact for the resource
Provided by
Years
Formats
Representation types
Update frequencies
status
Scale
-
.png)
Le radar BASTA est un radar nuage (95GHz) dédié à l’étude des nuages et du brouillard. Le radar mesure l’énergie rétrodiffusée par les hydrométéores, cette énergie peut donc être reliée à la quantité d’eau contenue dans le nuage (liquide et glace). Il fonctionne en routine quotidiennement sur le site de l’observatoire du Maïdo, sur l'Ile de La Réunion. Le radar BASTA Réunion a été calibré au LATMOS avant son installation à la Réunion. Ce jeu de données est au format niveau L0. Paramètre principal: Profil vertical de réflectivité radar, mesure du décalage Doppler. Contexte de la mesure: observation routine.
-
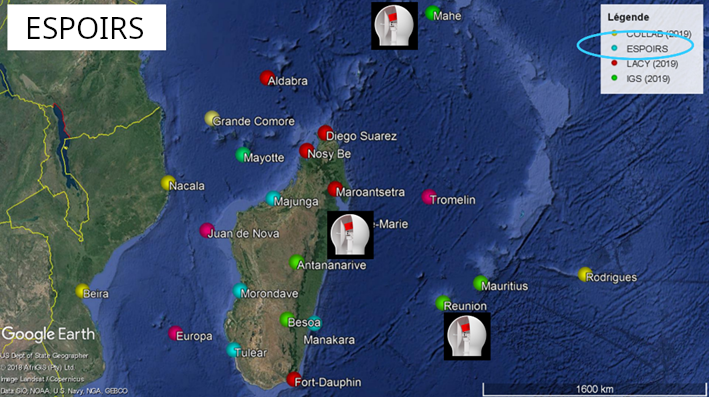
The overall objective of the ESPOIRS project is to obtain a better understanding of the variability, statistical properties and formation mechanisms of intense tropical precipitation at regional and local scales. ESPOIRS is thus interested in the entire life cycle of precipitation at several space-time scales. * Through the analysis of the distribution of the large-scale humidity field which drives the formation of precipitation at the regional scale using a GNSS network. * Through the characterization of internal (dynamics, microphysics) and external (interactions with the relief) processes, which drive the formation and life cycle of extreme weather events at the local scale => transportable Polarized Doppler X-band precipitation radar.
-
WW3 model reanalysis on SWIO (south-western indian ocean) area at 0.5 degree of resolution
-
Since 2012, 3 lidars from the Atmospheric Physics Observatory of La Réunion (OPAR) have been performing aerosol profile measurements at the Maïdo observatory site, located at 2160 meters to the west of the island of La Réunion. These profiles are obtained at several wavelengths, 355nm and 532nm, and there are also depolarized channels at 532nm. The data from these 3 lidars are processed in two stages: initially, the data are manually cleaned of disturbed profiles, either by atmospheric effects, such as the passage of clouds, or by electronic effects like noise. They are then summed over the night. This is the L1b level, and the data are available in the Matlab format (.mat). Subsequently, the data are processed to convert from a profile of received photon number to a profile of aerosol extinction and scattering. The methodology used is based on the Klett calculation at one wavelength. This is the L2b level, and the data are available in the NetCDF format (.nc) with the NDACC convention in the choice of variable names. Therefore, the data are distributed across 6 directories, 2 levels of processing for each lidar. The raw data from the instrument (called L0) are in a proprietary format, the Licel format, and are not accessible in open access, only via FTP with restricted access.
-
Le projet a pour objectif d'améliorer le signal de la pluie détectée par les géophones en comparant les données météorologiques d'un disdromètre, d'un pluviomètre et de 3 géophones afin d'extraire des données des sismographes pour mieux comprendre le transport sédimentaire issu du réseau sismologique installé dans la rivière des pluies et la rivière du Mat. Les objectifs sont : 1) déterminer les caractéristiques sismiques de la pluie sur le site de mesures 2) A terme, comprendre le déclenchement des éboulements et glissements liés aux pluies A court terme, ce projet devrait aussi permettre de : 1) comprendre pour un même type de pluie l'influence de sols de rugosités différentes sur les signaux enregistrés par les sismomètres 2) intégrer/contraindre pour un même type de sol l'influence de types de pluies différentes sur les enregistrements des sismomètres 3) déterminuer l'influence des tailles des gouttes et du nombre de gouttes (indications données par le disdromètre) sur le signal sismique
-
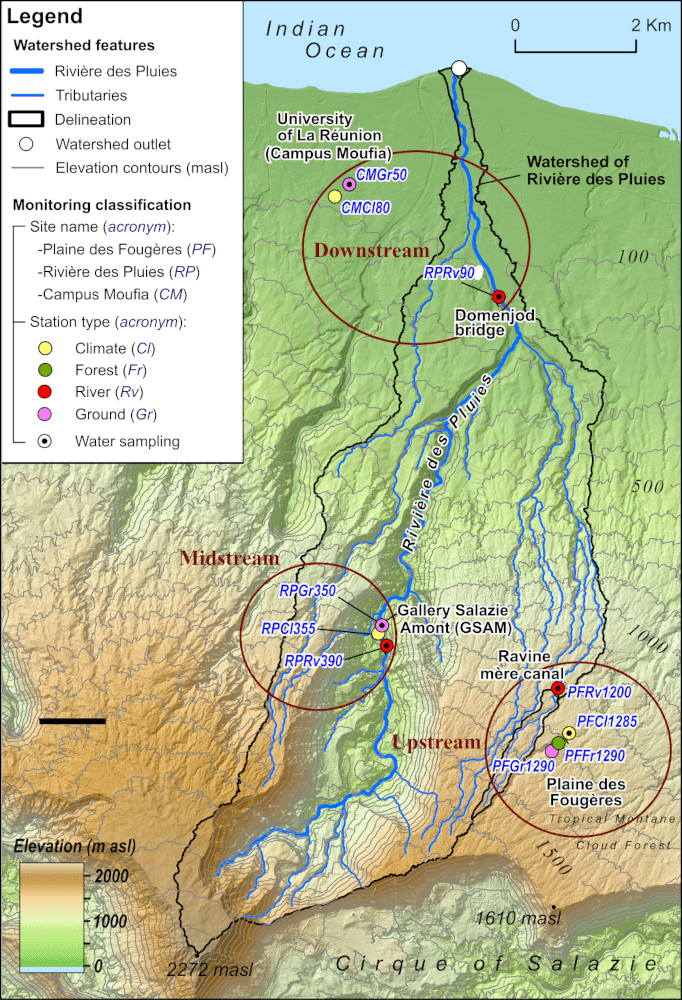
The station is managed by the Observatoire de la Zone Critique de la Réunion (OZC-R) from Observatoire des Sciences de l'Univers de La Réunion (OSU-Réunion, Université de La Réunion). This is a forest station located at 1285m asl in the Reunion National Park. Rainwater is monthly collected (PALMEX rain collector) for δ18O and δ2H water isotopes analysis from 2016. Analyses are carried out at the Institut de Physique du Globe in Paris (PARI analytical platform) and within the IR-OZCAR network. The major ions rainfall composition is also studied. The station also measures several meteorological variables outside the canopy (precipitation, atmospheric pressure, temperature, relative humidity, global and photosynthetically active radiation) but also humidity linked to clouds and fog, as well as ground temperature.
-
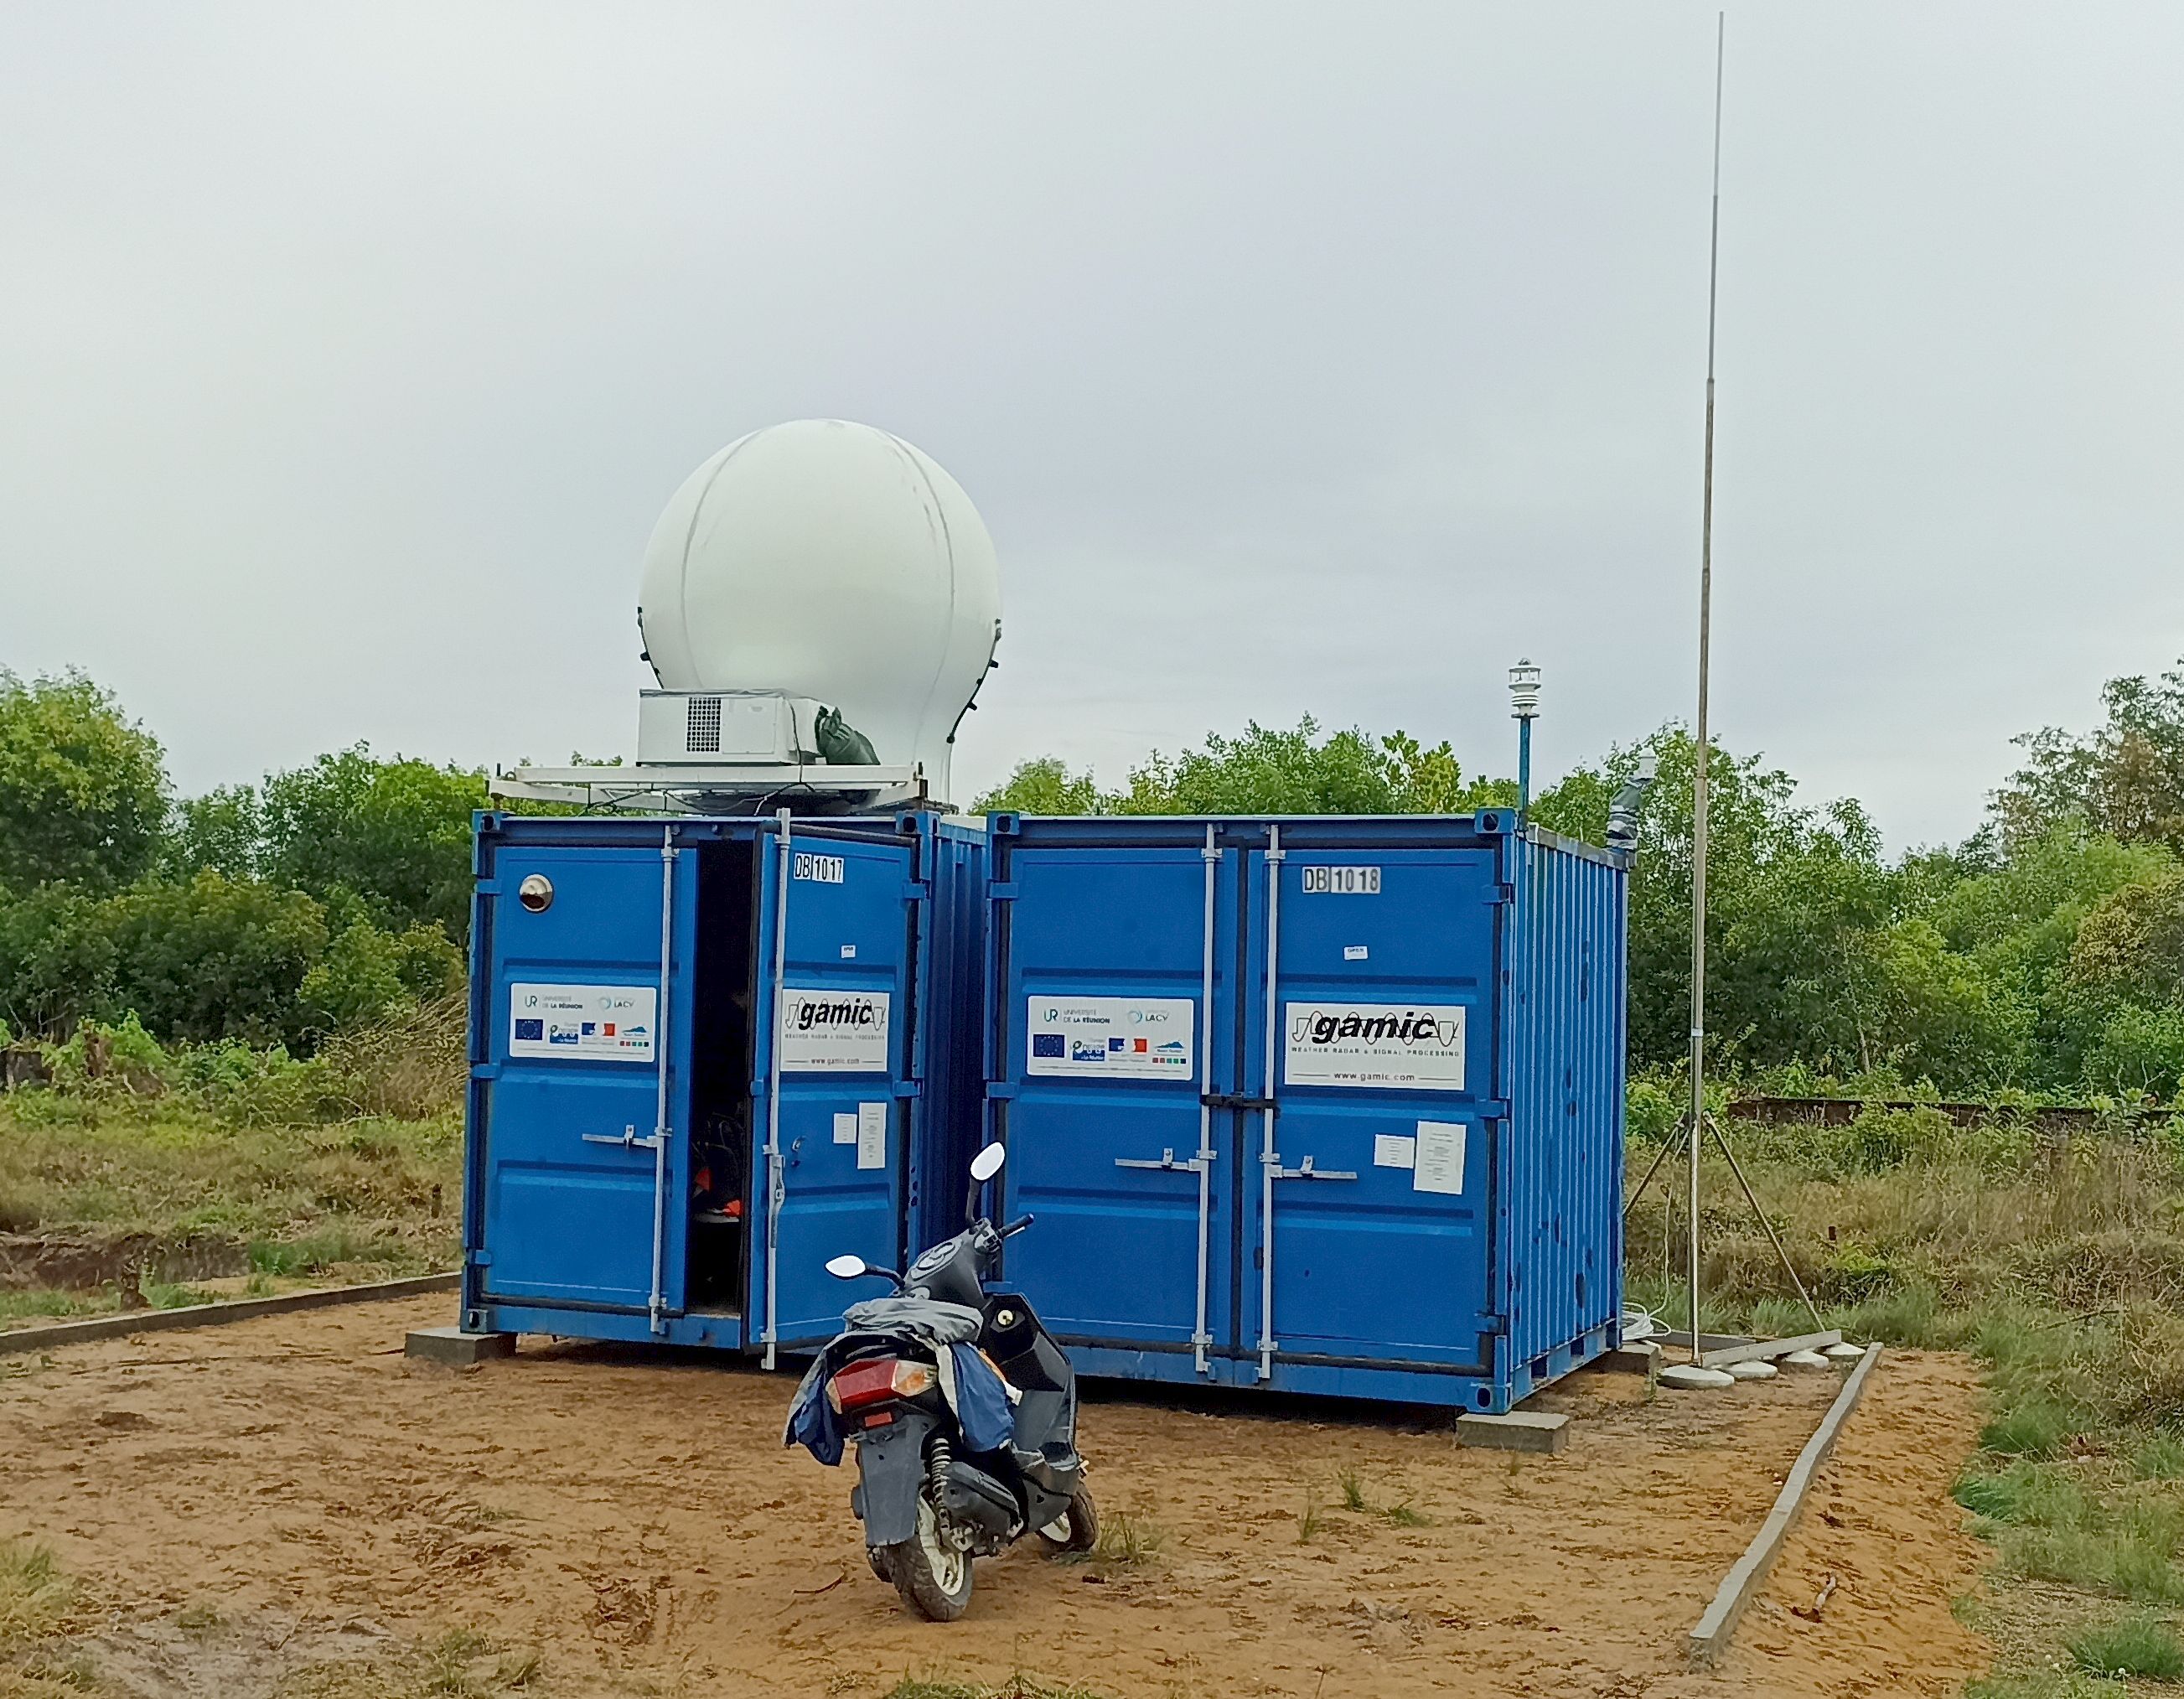
The ressource describes the dataset obtained by deploying the GAMIC GMWR-25-DP RADAR in Toamasina (Tamatave) in Madagascar.
-

This dataset encompasses model outputs generated by the Weather Research and Forecasting (WRF) regional climate model. A high-resolution (~1km) downscaling simulation was performed over two tropical islands, Reunion and Mauritius, situated in the South-West Indian Ocean (SWIO), with initial and boundary conditions provided by the ERA5 reanalysis with a global resolution of 0.25° × 0.25°. The simulation used three nested domains sequentially configured with spatial resolutions of 9, 3, and 1km, respectively, with a downscaling ratio of 3. The physical configurations of this simulation were determined through previous modeling studies and sensitivity tests. The published simulation data currently covers a period of 10 years, starting from 1991 (with the possibility to be extended to 30 years). Over 60 output variables were selected for publication with open access, including those related to the intermittent energy resources (e.g., surface solar radiation and its direct/diffuse components, wind speed/direction at multiple vertical levels, and precipitation, of interest for the run-off-river hydropower), as well as the widely used climatic/meteorological variables (e.g., temperature, pressure, humidity, etc.) at a temporal resolution varying from a day up to 30 minutes. All the data are available through an open-access data server, where an intelligent algorithm is applied to simplify the download process for data users. For the first time, a long-term, high-resolution climate/meteorological dataset covering Reunion and Mauritius has been simulated and published as open-access data, yielding substantial benefits to studies on climate modeling, weather forecasting, and even those related to climate change in the SWIO region. In particular, this dataset will enable a better understanding of the temporal and spatial characteristics of intermittent climate-related energy resources, consequently facilitating their implementation towards a green and low-carbon future.
-

The resource provides two land cover maps of Réunion Island for the years 1950 and 2022 derived from the analysis of ortho-photographs at the island scale (Source IGN). The produced typology uses five cover classes: forest, low vegetation, agriculture, urban, and shadow (related to topography). The method used is based on encoding the two aligned rasters, converted into a single band of grayscale for 2022, using a vision-transformer deep learning model. From the features calculated for each pixel, a random forest classification model is trained separately for each year using a set of ROIs (Regions Of Interest), target polygons delineated within each of the selected classes through photo-interpretation of the original images. Model validation is performed on independent sets of polygons also defined by photo-interpretation. The maps provided in the resource are derived from the prediction of cover classes for both years using the trained and validated models. These are raw predictions, meaning that no post-processing has been applied to reduce potential noise due to classification errors. The shared resource is part of the results from the FRAG'ILE research and development program (FRAGmentation en milieu InsuLairRE, UR / CBNM/ IRD, funded by OFB, https://fragile.frama.io).
-
Radiomètre micron-onde de haute précision pour la mesure de profils atmosphériques de vapeur d'eau et de température en continue