 Geosur
Type of resources
Available actions
Topics
INSPIRE themes
Keywords
Contact for the resource
Provided by
Years
Formats
Representation types
Update frequencies
status
Scale
-
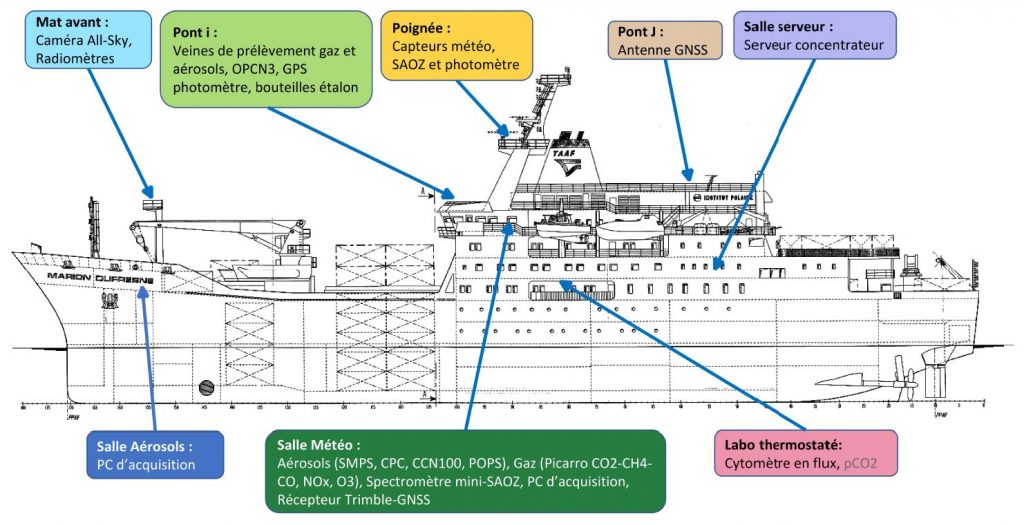
Le projet MAP-IO vise à effectuer des observations atmosphériques et de biologie marine sur le long terme dans la région de l’ouest de l’océan Indien. Ces données seront bancarisées en open-source à la fois dans les réseaux internationaux (ICOS, ACTRIS) qui sont utilisés pour initialiser et valider les modèles climatiques du GIEC et les satelittes et sur la base de données GeOSUR dédiée à la recherche et à l’ensemble des acteurs du territoire. Elles permettront d’avancer sur notre compréhension des échanges océan-atmosphère, sur la pollution régionale et sur les mécanismes chimiques en permettant d’améliorer et d’adapter les paramétrisations utilisées dans les modèles numériques de prévision du temps et de climat sur la région ouest de l’océan Indien. La stratégie de MAP-IO s’inscrit dans la continuité et la valorisation des investissements de la région Réunion en renforçant les bases de données des programmes scientifiques ReNovRisk Cyclones et Changement Climatique (INTERREG V) et UV-INDIEN (INTERREG V) et l’infrastructure « Observatoire du Maïdo » (FEDER). MAP-IO viendra renforcer la place de la Réunion dans les grandes infrastructures de recherches Européenne ACTRIS (http://www.actris.fr/) et ICOS (https://www.icos-france.fr/). A terme, l’objectif est de faire de La Réunion un hub de surveillance du climat et des changements globaux de niveau international permettant une percolation des produits de recherche vers l’activité économique et sociétal du territoire. MAP-IO s’inscrit également dans une action forte de La Réunion pour la croissance bleue dans les DOM (livre bleu de l’outre-mer, 2018). MAP-IO se positionne dès à présent dans les lignes directrices de la mission 3 du programme Horizon Europe (2021-2027) « Santé des océans et des eaux naturelles » et au sein des partenariats institutionnels du domaine 3 « Leadership européen dans le domaine de la métrologie, y compris un système intégré de métrologie ». Ce positionnement ouvrira des nouvelles opportunités de réponses des scientifiques de La Réunion aux appels d’offres au programme européen pour la recherche et l'innovation (Horizon Europe). Questions de recherche L’objectif du projet MAP-IO est d’étudier la composition de l’atmosphère et les processus océan-atmosphère ayant un impact sur le climat régional et la prévision numérique du temps. Ce programme scientifique s’appuie sur la bancarisation de données océaniques et atmosphériques en équipant le navire Marion Dufresne de plusieurs systèmes de mesure de l’atmosphère pérennes et autonomes. Ces systèmes d’observations ont cinq buts principaux: - Documenter l’état de surface océanique et la composition biologique en phytoplancton ; données permettant de participer à la calibration des données satellites et à la validation des modèles océaniques et biologiques sur l’océan Indien et austral. - Surveiller les changements atmosphériques globaux en particulier dans la région de l’océan Indien très faiblement documentée (réseaux NDACC, ACTRIS, ICOS). Bancariser les données en open data. - Étudier les transports de masses d’air et la redistribution des aérosols et des composés chimiques dans la troposphère et la stratosphère (programmes IGAC et SPARC). - Documenter les émissions de gaz et d’aérosols marins pour les modèles atmosphériques de prévision numérique ou de climat (programme SOLAS). - Renforcer les réseaux régionaux d’observation du changement climatique régional déployés dans le cadre des programmes ReNovRisk Cyclones et Changement Climatique (INTERREG-V), IOGA4MET (TAAF, AAP Iles Eparses) et UV-indien (INTERREG-V). Actions et méthodes scientifiques Le programme MAP-IO s’est construit autour de deux fiches actions. La fiche action 1 « amélioration de la connaissance » correspond aux études scientifiques qui seront abordées à partir des observations à bord du Marion Dufresne pendant 24 mois. Elle sont déclinés en 5 sous actions. - 1.1 : Distribution spatiale et hétérogénéité structurelle des groupes fonctionnels du phytoplancton et du microzooplancton, couplage avec les images satellite de couleur de l’eau. Mise en œuvre d’un cytomètre en flux. - 1.2 : Échanges océan-atmosphère: aérosols marins et composition de la couche limite marine. Mise en œuvre de mesures in-situ de gaz et d’aérosols. - 1.3 : Climatologie et variabilité des rayonnements UV et de l’ozone dans l’Océan Indien. Mise en œuvre de mesures UV A,B et C et de colonne intégrée d’ozone. - 1.4 : Étude des panaches d’aérosols issus des feux de biomasse et en provenance du Sud de l’Afrique, de l’Amérique du Sud et de l’Asie du Sud-Est. Mise en œuvre d’un photomètre solaire/lunaire pour l’épaisseur optique des aérosols. - 1.5 : Surveillance du champ de vapeur d’eau à l’échelle du bassin SOOI. Mise en œuvre d’un GNSS. La fiche action 2 correspond au management et à la valorisation du programme. Cette action intègre la (i) coordination et la gestion administrative et financière du programme et (ii) une conférence de restitution du programme et d’organisation d’un modèle économique de fonctionnement perenne de MAP-IO. Partenaires MAP-IO intègre une équipe de 17 scientifiques de haut niveau, responsables notamment de plusieurs services nationaux d’observation de l’atmosphère tels que NDACC, CLAP et PHOTON et bien intégrés au sein des infrastructures de recherche Européenne ACTRIS et ICOS. Dans ce cadre MAP-IO permettra de renforcer les liens collaboratifs entre scientifiques issus de 7 laboratoires de métropole et ceux de l’université de La Réunion. Ce réseau de scientifique pourra se densifier si l’université de La Réunion et ses partenaires au travers de MAP-IO montrent leur capacité à maintenir sur le long terme ces observations régulières uniques au monde.
-
Honga Tonga Aerosols measurments from lidars at Maïdo observatory, Reunion Island (21.08°S, 55.38°E)
To do
-
Le projet a pour objectif d'améliorer le signal de la pluie détectée par les géophones en comparant les données météorologiques d'un disdromètre, d'un pluviomètre et de 3 géophones afin d'extraire des données des sismographes pour mieux comprendre le transport sédimentaire issu du réseau sismologique installé dans la rivière des pluies et la rivière du Mat. Les objectifs sont : 1) déterminer les caractéristiques sismiques de la pluie sur le site de mesures 2) A terme, comprendre le déclenchement des éboulements et glissements liés aux pluies A court terme, ce projet devrait aussi permettre de : 1) comprendre pour un même type de pluie l'influence de sols de rugosités différentes sur les signaux enregistrés par les sismomètres 2) intégrer/contraindre pour un même type de sol l'influence de types de pluies différentes sur les enregistrements des sismomètres 3) déterminuer l'influence des tailles des gouttes et du nombre de gouttes (indications données par le disdromètre) sur le signal sismique
-
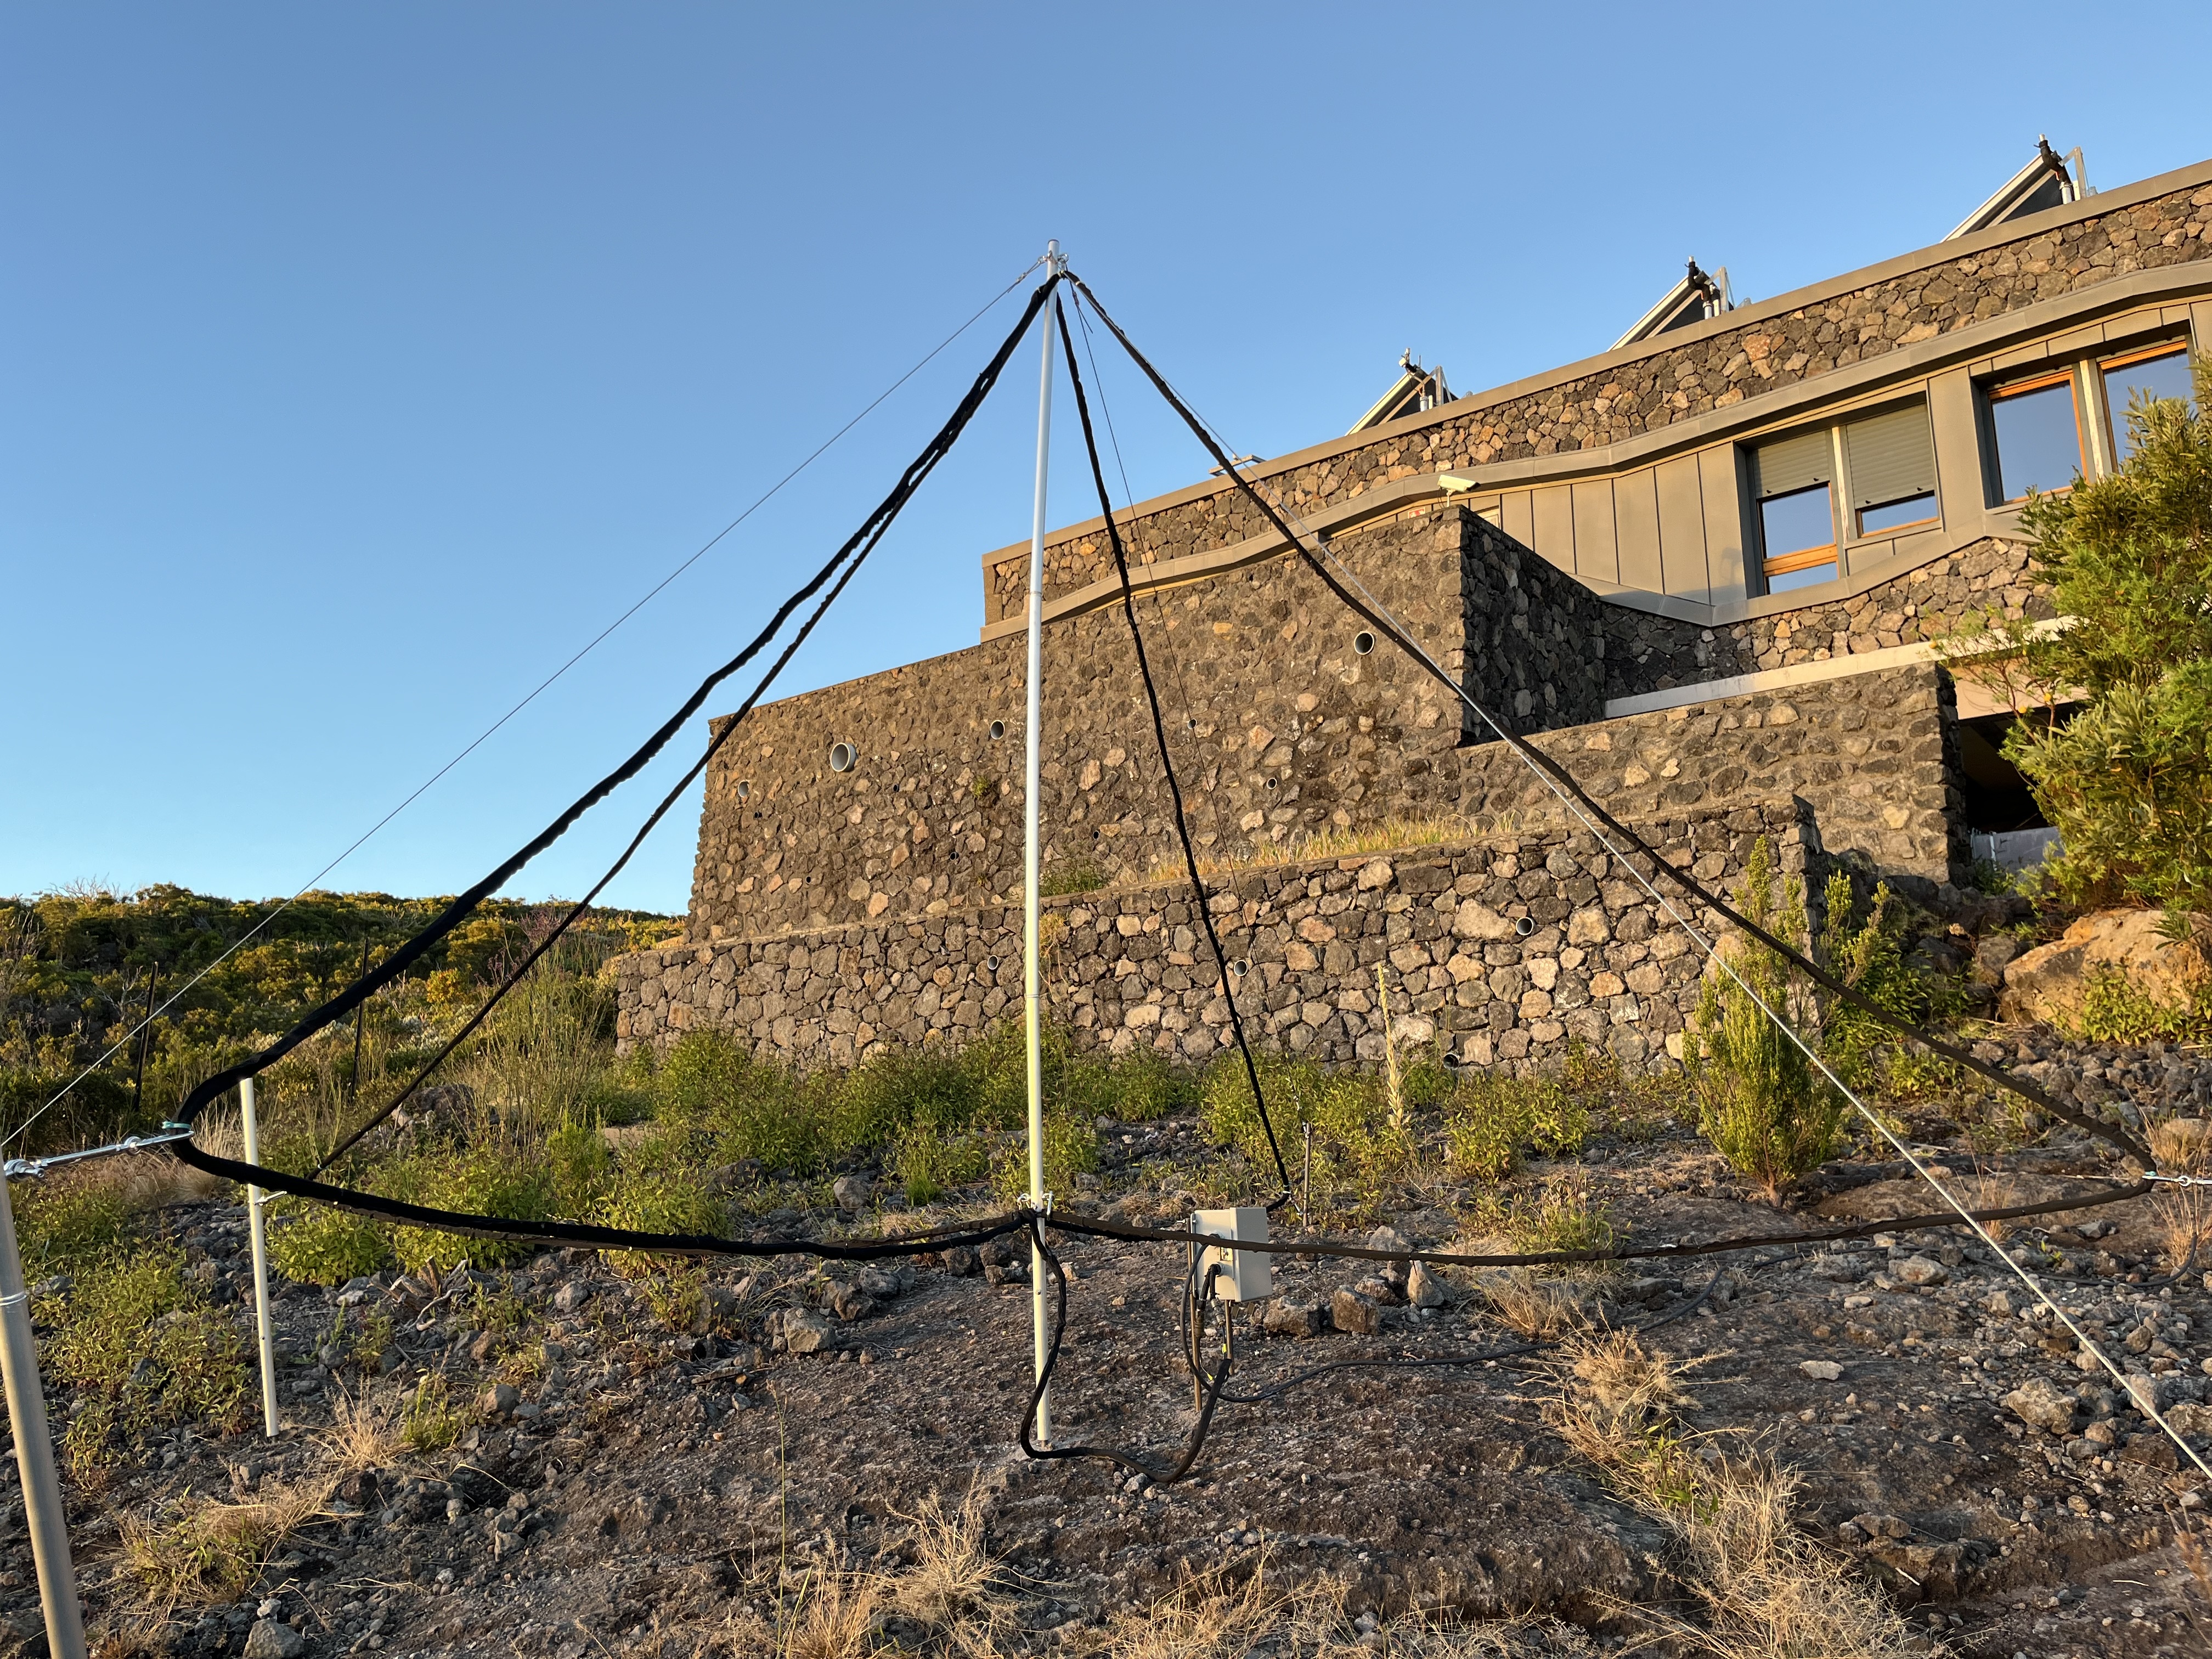
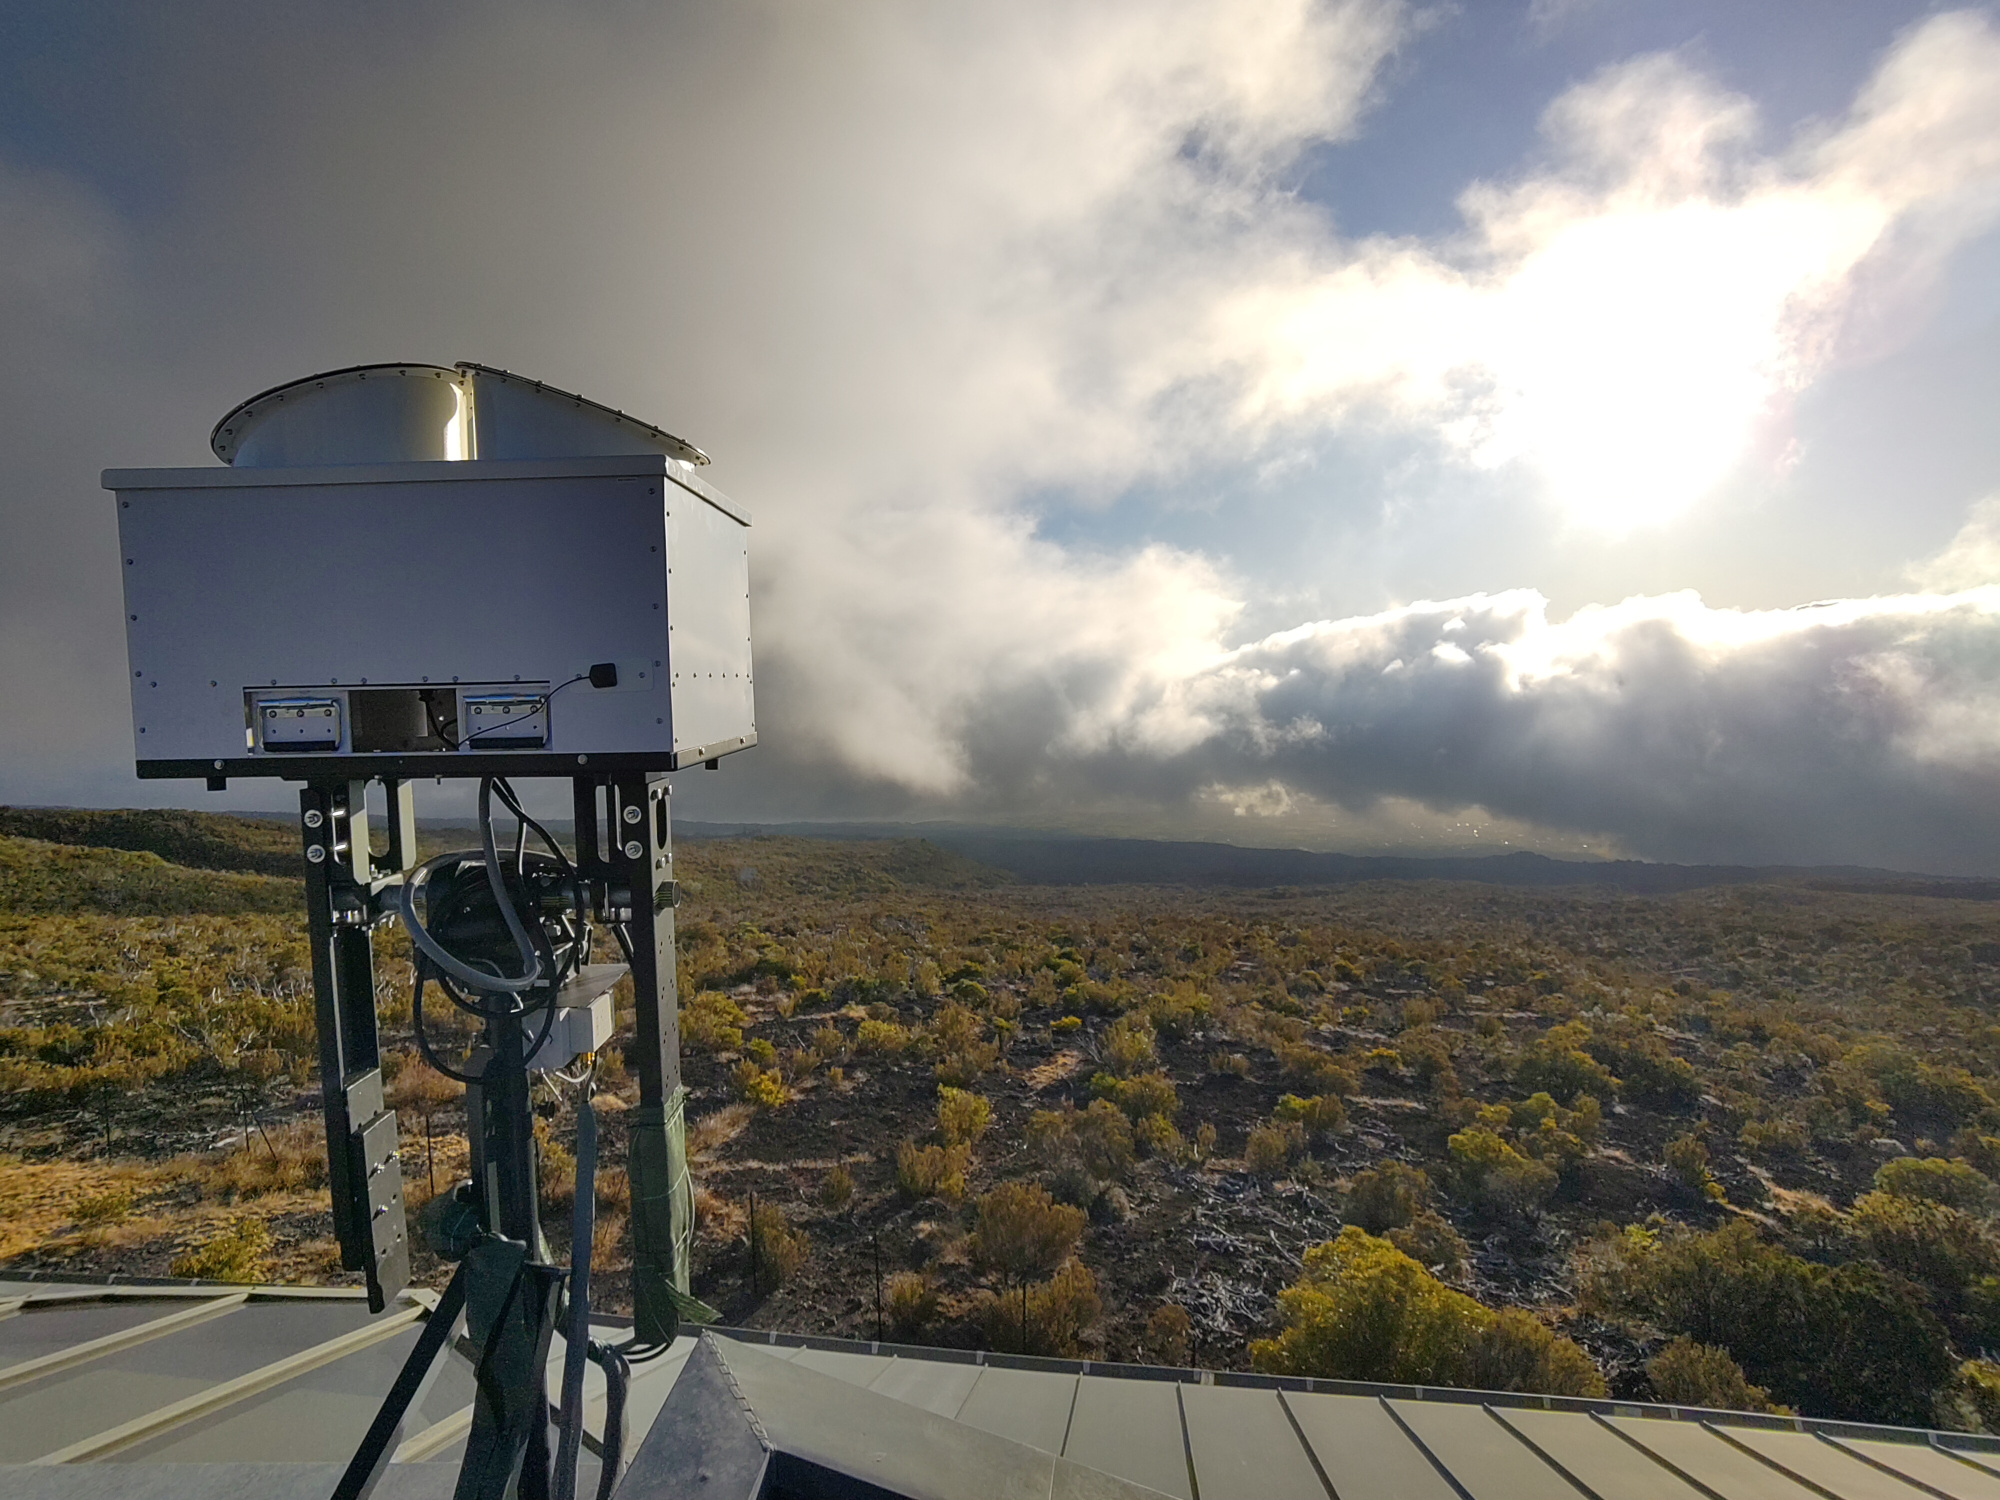
Les ondes VLF émisent par des transmetteurs sur Terre, se propagent dans le guide d'onde formé par l'ionosphère et la Terre. En cas de changement de conductivité des limites de ce guide d'onde, les signaux reçus sont modifiés. C'est ce qu'il peut arriver par un forçage d'origine solaire (éruptions) ou liés à des zones orageuses (TLE). L'analyse de ces signaux en amplitude et phase permet de remonter à la perturbation de la densité électronique. Celle-ci induit notamment une augmentation de l'absorption HF. Outre les études sur la réponse de l'ionosphère à un forçcage (solaire ou TLE), le projet a une dimension sociétal en fournissant des alertes temps réel sur l'occurrence d'une éruption solaire. L'instrument est composé de deux "boucles" (plutôt des triangles) magnétiques orientées NS et EW. La base de l'antenne mesure 4.57m, la hauteur 2.80m, soit une surface totale de 5.22m2. Avec 11 tours de fil de cuivre on obtient une sensibilité de 3.57E-13 T/rt-Hz; Les "boucles" sont connectées à un pré-ampli situé au pied du mât. Ce pré-amp contient également le système de calibration. Un câble apportant l'électricité et ramenant les signaux part du pré-amp, courre dans les chemins de câble et arrive au "line Receiver", un boite électronique jaune située près du PC de contrôle. Cette électronique contient un ADC et reçoit le timing du GPS. L'ensemble des signaux est ensuite conduit vers le PC de contrôle qui effectue la démodulation des signaux MSK (méthode de transmission des données VLF) et produit les données NarrowBand et BroadBand. L'instrument fonctionne en continue 24/365. Le PC redémarre seul en cas de coupure d'électricité. Pour vérifier que l'instrument est bien en fonctionnement, il suffit de regarder la date et l'heure du spectrogramme affiché (rafraichissement toutes les minutes).
-
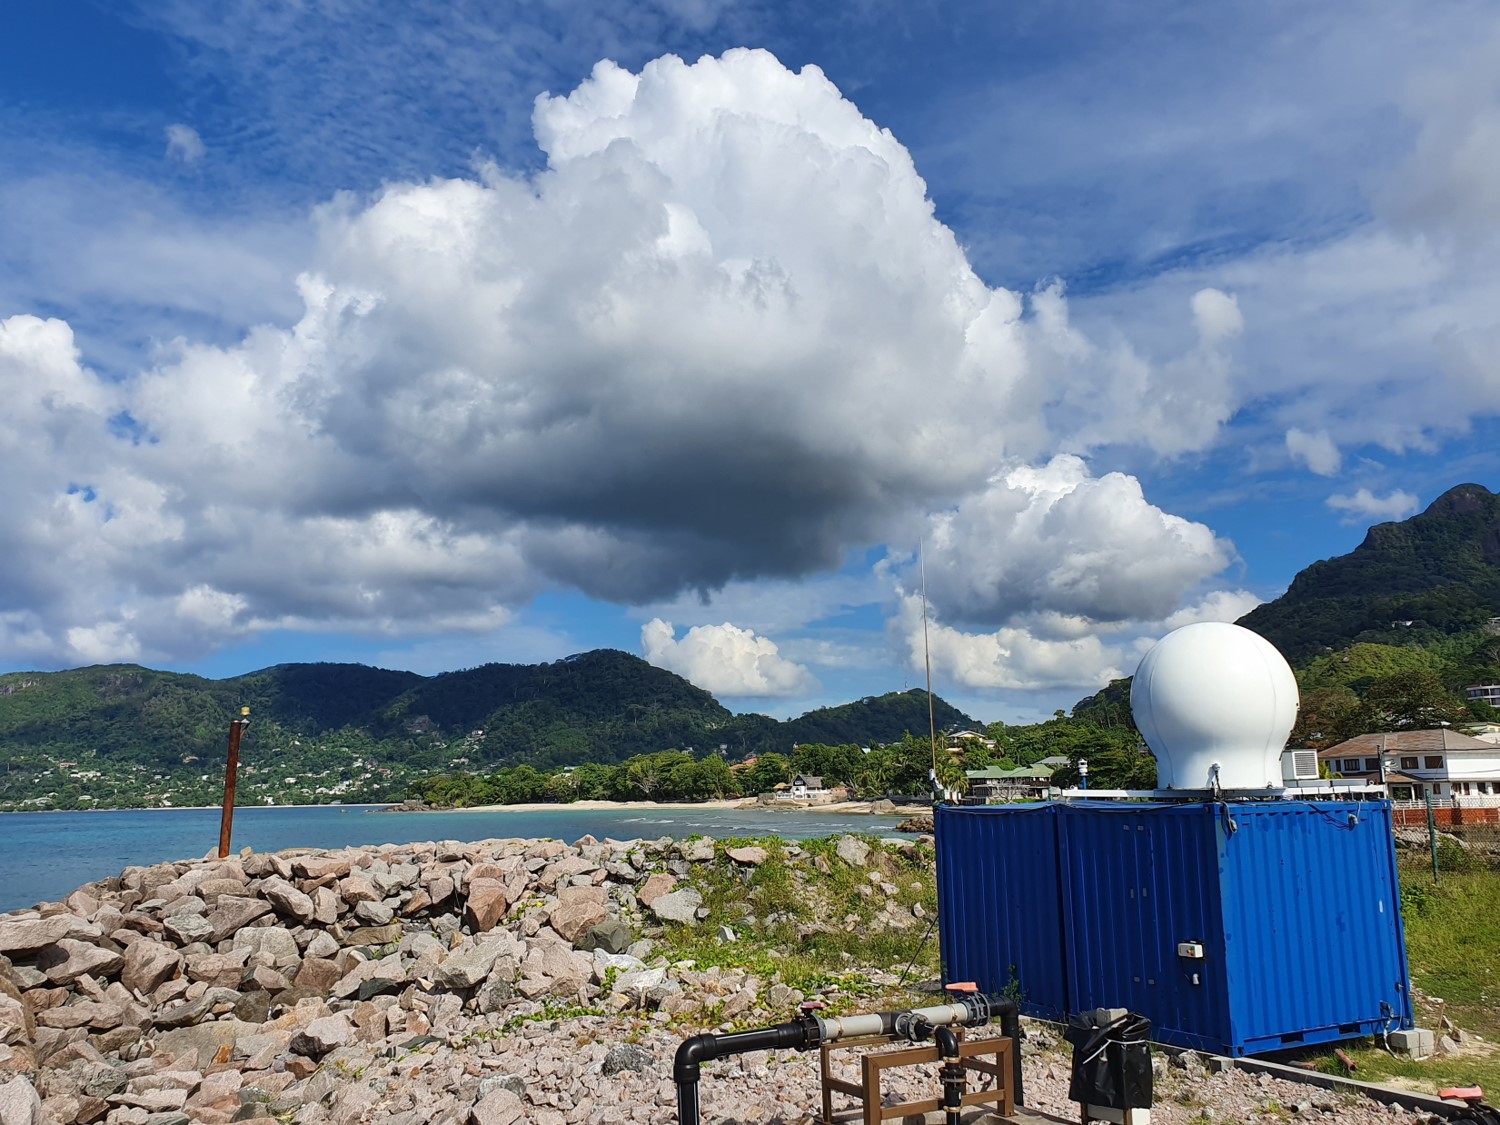
The ressource describes the dataset obtained by deploying the GAMIC GMWR-25-DP RADAR in the north of Mahé Island, in Seychelles.
-
Rain gauge measurements in watershed "Rivière des Pluies", Reunion Island 2 types of rain gauge: - Pluviographe: rain gauge with tipping (0,2 mm). Location: Piton Fougères - Adding rain gauges which is applied the chemistry water protocol. Location: Piton Fougères and University (Moufia-Saint Denis) Laboratoire Géosciences Réunion – IPGP
-

Piezometer measurements in watershed "Rivière des Pluies", Reunion Island Continuous measures in groundwater: - Level water (systematically) - Temperature (sometimes) - Conductivity (sometimes) Laboratoire Géosciences Réunion – IPGP
-
Le radar mini-BASTA est un radar nuage (95GHz) dédié à l’étude des nuages et du brouillard. Le radar mesure l’énergie rétrodiffusée par les hydrométéores, cette énergie peut donc être reliée à la quantité d’eau contenue dans le nuage (liquide et glace). Il fonctionne en routine quotidiennement sur le site de l’observatoire du Maïdo, sur l'Ile de La Réunion. Ce jeu de données est au niveau L0, et les données sont non calibrées. Paramètre principal: Profil vertical de réflectivité radar, mesure du décalage Doppler. Contexte de la mesure: observation routine.
-
Radiomètre micron-onde de haute précision pour la mesure de profils atmosphériques de vapeur d'eau et de température en continue
-

This dataset encompasses model outputs generated by the Weather Research and Forecasting (WRF) regional climate model. A high-resolution (~1km) downscaling simulation was performed over two tropical islands, Reunion and Mauritius, situated in the South-West Indian Ocean (SWIO), with initial and boundary conditions provided by the ERA5 reanalysis with a global resolution of 0.25° × 0.25°. The simulation used three nested domains sequentially configured with spatial resolutions of 9, 3, and 1km, respectively, with a downscaling ratio of 3. The physical configurations of this simulation were determined through previous modeling studies and sensitivity tests. The published simulation data currently covers a period of 10 years, starting from 1991 (with the possibility to be extended to 30 years). Over 60 output variables were selected for publication with open access, including those related to the intermittent energy resources (e.g., surface solar radiation and its direct/diffuse components, wind speed/direction at multiple vertical levels, and precipitation, of interest for the run-off-river hydropower), as well as the widely used climatic/meteorological variables (e.g., temperature, pressure, humidity, etc.) at a temporal resolution varying from a day up to 30 minutes. All the data are available through an open-access data server, where an intelligent algorithm is applied to simplify the download process for data users. For the first time, a long-term, high-resolution climate/meteorological dataset covering Reunion and Mauritius has been simulated and published as open-access data, yielding substantial benefits to studies on climate modeling, weather forecasting, and even those related to climate change in the SWIO region. In particular, this dataset will enable a better understanding of the temporal and spatial characteristics of intermittent climate-related energy resources, consequently facilitating their implementation towards a green and low-carbon future.