 Geosur
geoscientificInformation
Type of resources
Available actions
Topics
INSPIRE themes
Keywords
Contact for the resource
Provided by
Years
Formats
Representation types
Update frequencies
status
Scale
-
This dataset encompasses model outputs generated by the Weather Research and Forecasting (WRF) regional climate model. A high-resolution (~1km) downscaling simulation was performed over two tropical islands, Reunion and Mauritius, situated in the South-West Indian Ocean (SWIO), with initial and boundary conditions provided by the ERA5 reanalysis with a global resolution of 0.25° × 0.25°. The simulation used three nested domains sequentially configured with spatial resolutions of 9, 3, and 1km, respectively, with a downscaling ratio of 3. The physical configurations of this simulation were determined through previous modeling studies and sensitivity tests. The published simulation data currently covers a period of 10 years, starting from 1991 (with the possibility to be extended to 30 years). Over 60 output variables were selected for publication with open access, including those related to the intermittent energy resources (e.g., surface solar radiation and its direct/diffuse components, wind speed/direction at multiple vertical levels, and precipitation, of interest for the run-off-river hydropower), as well as the widely used climatic/meteorological variables (e.g., temperature, pressure, humidity, etc.) at a temporal resolution varying from a day up to 30 minutes. All the data are available through an open-access data server, where an intelligent algorithm is applied to simplify the download process for data users. For the first time, a long-term, high-resolution climate/meteorological dataset covering Reunion and Mauritius has been simulated and published as open-access data, yielding substantial benefits to studies on climate modeling, weather forecasting, and even those related to climate change in the SWIO region. In particular, this dataset will enable a better understanding of the temporal and spatial characteristics of intermittent climate-related energy resources, consequently facilitating their implementation towards a green and low-carbon future.
-

The beach profile is a sectional representation of its topography. The beach topography and its dynamics (by beach profile or transect approach) is illustrated by the acquisition of altimetry data along a fixed profile. 42 profiles are regularly monitored on the reef coast of Reunion Island: 2 profiles per year before the swell seasons of summer and austral winter; the impact of the events of strong swells (cyclones, southern swells) is systematically measured on the labeled Dynalit sites and more sporadically on the other sites. The methodology deployed locally since 2012.
-
The beach profile is a sectional representation of its topography. The beach topography and its dynamics (by beach profile or transect approach) is illustrated by the acquisition of altimetry data along a fixed profile. 22 profiles are regularly monitored on the reef coast of Reunion Island: 2 profiles per year before the swell seasons of summer and austral winter; the impact of the events of strong swells (cyclones, southern swells) is systematically measured on the labeled Dynalit sites and more sporadically on the other sites. The methodology deployed locally since 2012 involves two Topcon Hiper II receivers (base and mobile) and one Topcon FC-250 controller (field notebook).
-

The coastline or shoreline is the geographical boundary between sea and land. It corresponds according to the SHOM to "the leash of the highest seas in the context of an astronomical tide of coefficient 120 and under normal weather conditions (without overcost phenomenon). The coastline as defined above is not directly identifiable continuously on the ground or on a satellite or aerial image. From a perspective of studying the displacement of the shoreline, indicators allow us to approach this notion (the vegetation limit associated with the infrastructure limit, the beach limit, etc.). On the reef shoreline of Reunion Island the limit of vegetation and infrastructure as well as beach limit were retained. This limit results in the production of a line-type vector geographic information layer in a GIS resulting from photo-interpolation on the orthophotos of IGN also called BD ORTHO. BD ORTHO is a component of the RGE®. These are digital color orthophotos supplied in raster format (tiff, ecw, ..). An orthophotography is a digital image that has the same metrics as a map of the same projection for the same elements on the ground. They have been available since 1997 in Réunion with a five-year repeatability. Their spatial resolution increased from 1 m in 1997 to 50 cm in 2003. UMR Espace-Dev
-

The coastline or shoreline is the geographical boundary between sea and land. It corresponds according to the SHOM to "the leash of the highest seas in the context of an astronomical tide of coefficient 120 and under normal weather conditions (without overcost phenomenon). The coastline as defined above is not directly identifiable continuously on the ground or on a satellite or aerial image. From a perspective of studying the displacement of the shoreline, indicators allow us to approach this notion (the vegetation limit associated with the infrastructure limit, the beach limit, etc.). On the reef shoreline of Reunion Island the limit of vegetation and infrastructure as well as beach limit were retained. This limit results in the production of a line-type vector geographic information layer in a GIS resulting from the photo-interpolation on Pléiades satellite images. Pleiades satellite images from the Kalideos Réunion database (CNES) have been used since 2016 to study the position of the shoreline annually. Launched in 2011, Pléiades is a very high spatial resolution spatial image system (panchromatic optical instrument at 70 cm and 2.8 m multispectral) operating in the visible and near infrared with a swath of 20 km UMR Espace-Dev
-
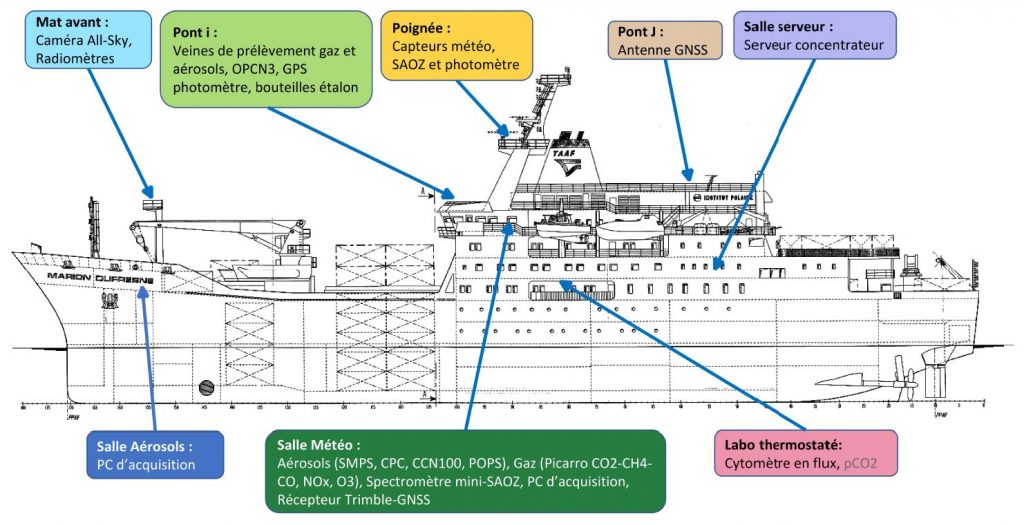
Le projet MAP-IO vise à effectuer des observations atmosphériques et de biologie marine sur le long terme dans la région de l’ouest de l’océan Indien. Ces données seront bancarisées en open-source à la fois dans les réseaux internationaux (ICOS, ACTRIS) qui sont utilisés pour initialiser et valider les modèles climatiques du GIEC et les satelittes et sur la base de données GeOSUR dédiée à la recherche et à l’ensemble des acteurs du territoire. Elles permettront d’avancer sur notre compréhension des échanges océan-atmosphère, sur la pollution régionale et sur les mécanismes chimiques en permettant d’améliorer et d’adapter les paramétrisations utilisées dans les modèles numériques de prévision du temps et de climat sur la région ouest de l’océan Indien. La stratégie de MAP-IO s’inscrit dans la continuité et la valorisation des investissements de la région Réunion en renforçant les bases de données des programmes scientifiques ReNovRisk Cyclones et Changement Climatique (INTERREG V) et UV-INDIEN (INTERREG V) et l’infrastructure « Observatoire du Maïdo » (FEDER). MAP-IO viendra renforcer la place de la Réunion dans les grandes infrastructures de recherches Européenne ACTRIS (http://www.actris.fr/) et ICOS (https://www.icos-france.fr/). A terme, l’objectif est de faire de La Réunion un hub de surveillance du climat et des changements globaux de niveau international permettant une percolation des produits de recherche vers l’activité économique et sociétal du territoire. MAP-IO s’inscrit également dans une action forte de La Réunion pour la croissance bleue dans les DOM (livre bleu de l’outre-mer, 2018). MAP-IO se positionne dès à présent dans les lignes directrices de la mission 3 du programme Horizon Europe (2021-2027) « Santé des océans et des eaux naturelles » et au sein des partenariats institutionnels du domaine 3 « Leadership européen dans le domaine de la métrologie, y compris un système intégré de métrologie ». Ce positionnement ouvrira des nouvelles opportunités de réponses des scientifiques de La Réunion aux appels d’offres au programme européen pour la recherche et l'innovation (Horizon Europe). Questions de recherche L’objectif du projet MAP-IO est d’étudier la composition de l’atmosphère et les processus océan-atmosphère ayant un impact sur le climat régional et la prévision numérique du temps. Ce programme scientifique s’appuie sur la bancarisation de données océaniques et atmosphériques en équipant le navire Marion Dufresne de plusieurs systèmes de mesure de l’atmosphère pérennes et autonomes. Ces systèmes d’observations ont cinq buts principaux: - Documenter l’état de surface océanique et la composition biologique en phytoplancton ; données permettant de participer à la calibration des données satellites et à la validation des modèles océaniques et biologiques sur l’océan Indien et austral. - Surveiller les changements atmosphériques globaux en particulier dans la région de l’océan Indien très faiblement documentée (réseaux NDACC, ACTRIS, ICOS). Bancariser les données en open data. - Étudier les transports de masses d’air et la redistribution des aérosols et des composés chimiques dans la troposphère et la stratosphère (programmes IGAC et SPARC). - Documenter les émissions de gaz et d’aérosols marins pour les modèles atmosphériques de prévision numérique ou de climat (programme SOLAS). - Renforcer les réseaux régionaux d’observation du changement climatique régional déployés dans le cadre des programmes ReNovRisk Cyclones et Changement Climatique (INTERREG-V), IOGA4MET (TAAF, AAP Iles Eparses) et UV-indien (INTERREG-V). Actions et méthodes scientifiques Le programme MAP-IO s’est construit autour de deux fiches actions. La fiche action 1 « amélioration de la connaissance » correspond aux études scientifiques qui seront abordées à partir des observations à bord du Marion Dufresne pendant 24 mois. Elle sont déclinés en 5 sous actions. - 1.1 : Distribution spatiale et hétérogénéité structurelle des groupes fonctionnels du phytoplancton et du microzooplancton, couplage avec les images satellite de couleur de l’eau. Mise en œuvre d’un cytomètre en flux. - 1.2 : Échanges océan-atmosphère: aérosols marins et composition de la couche limite marine. Mise en œuvre de mesures in-situ de gaz et d’aérosols. - 1.3 : Climatologie et variabilité des rayonnements UV et de l’ozone dans l’Océan Indien. Mise en œuvre de mesures UV A,B et C et de colonne intégrée d’ozone. - 1.4 : Étude des panaches d’aérosols issus des feux de biomasse et en provenance du Sud de l’Afrique, de l’Amérique du Sud et de l’Asie du Sud-Est. Mise en œuvre d’un photomètre solaire/lunaire pour l’épaisseur optique des aérosols. - 1.5 : Surveillance du champ de vapeur d’eau à l’échelle du bassin SOOI. Mise en œuvre d’un GNSS. La fiche action 2 correspond au management et à la valorisation du programme. Cette action intègre la (i) coordination et la gestion administrative et financière du programme et (ii) une conférence de restitution du programme et d’organisation d’un modèle économique de fonctionnement perenne de MAP-IO. Partenaires MAP-IO intègre une équipe de 17 scientifiques de haut niveau, responsables notamment de plusieurs services nationaux d’observation de l’atmosphère tels que NDACC, CLAP et PHOTON et bien intégrés au sein des infrastructures de recherche Européenne ACTRIS et ICOS. Dans ce cadre MAP-IO permettra de renforcer les liens collaboratifs entre scientifiques issus de 7 laboratoires de métropole et ceux de l’université de La Réunion. Ce réseau de scientifique pourra se densifier si l’université de La Réunion et ses partenaires au travers de MAP-IO montrent leur capacité à maintenir sur le long terme ces observations régulières uniques au monde.
-
ReefTEMPS is a network created by the IRD, initially covering some twenty territories and island states in the South, South-West and West Pacific. ReefTEMPS-OI is the Indian Ocean version. The network uses temperature, pressure, salinity and other coastal observables to monitor climate change and its effects on coral reefs and their resources over the long term. ReefTEMPS is part of the French national federative Research Infrastructure for coastal ocean and seashore observations named IR I-LICO, accredited as a National Observation Service (SNO) by the CNRS-INSU Ocean-Atmosphere Commission. ReefTEMPS is operated by ENTROPIE since 2019. Previously, it was created and led by GOPS (a consortium of research observatories in the South Pacific) during the period 2010-2017, then coordinated by UMR LEGOS in 2018. ReefTEMPS-OI, its Indian Ocean version, is operated by OSU-Réunion since 2020.
-
Paramètre principal: Analyse chimique de SO2. Contexte de la mesure: STRAP.
-
Paramètre principal: Particle Size Distribution. Contexte de la mesure: STRAP.
-
Paramètre principal: Analyse chimique de SO2. Contexte de la mesure: STRAP.